RSI Indicator
The Relative Strength Index (RSI) is a tool that helps you understand a stock's price momentum by showing a graph with values between 0 and 100.
Go To Indicator, then click "Add To Favorite Indicators"
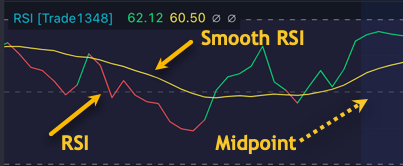
The custom Trade 1348 RSI provides useful information:
- Green: If the RSI crosses its moving average upwards, it can suggest a bullish price momentum shift.
- Red: If the RSI crosses its moving average downwards, it can indicate a bearish price momentum shift.
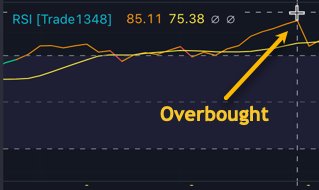
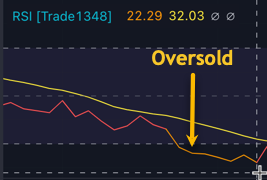
- Orange: If the RSI is above 70 (overbought) or below 30 (oversold), it might signal a price reversal.
- Midpoint (50): A break above or below 50 can hint at a trend change in that direction.
Overbought
Oversold
Use this RSI alongside other indicators for better trading decisions.