PSAR Indicator Candle Indicator
The Custom PSAR Candles Indicator is a tailored version of the popular PSAR (Parabolic Stop and Reverse) indicator. Its primary purpose is to identify trends and signal potential trend reversals, providing traders with a straightforward visual aid for risk management.
Go To Indicator, then click "Add To Favorite Indicators"
Understanding the Indicator Colors
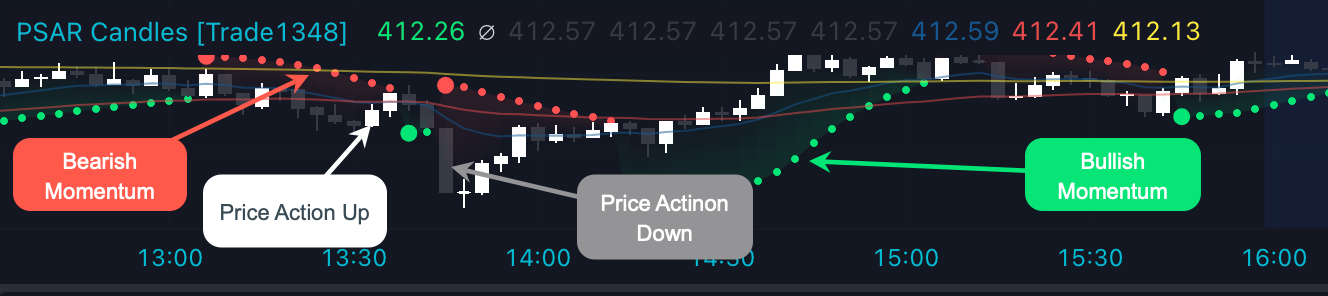
- Green: This indicates a bullish trend, but can also be used to mark where your stop loss should be placed when trading shares.
- Red: This denotes a bearish trend. It can also suggest when to exit a trade.
- White: A custom visual indication of price that is moving up or down.
Lagging Nature of PSAR: PSAR is a lagging indicator, meaning you should wait for the candle to close before making trading decisions based on its signals.
Companion to Traffic Lights: The Custom PSAR acts in tandem with traffic light signals, often highlighting a momentum shift before a traffic light confirmation.
Identifying Trends and Momentum Shifts:
- Trends: Green dots on the histogram indicate a bullish trend, while red dots suggest a bearish trend.
- Momentum Shifts: A single green dot following a series of red dots signifies a shift towards a bullish trend. Conversely, a single red dot after a sequence of green dots indicates a bearish shift in momentum.
Remember, the Custom PSAR Candles Indicator is a tool to assist in making informed trading decisions. Always consider other market factors and your risk tolerance before placing trades.