Free Chart
Getting started with 13/48 costs you nothing! We provide you our core chart at no charge and give you our basic building block to the most innovative trading strategy for momentum traders, scalpers and Traders with 9-5 jobs!
Features
Our free chart has everything you need to get started with trading the 13/48 strategy.
Let's break it down:
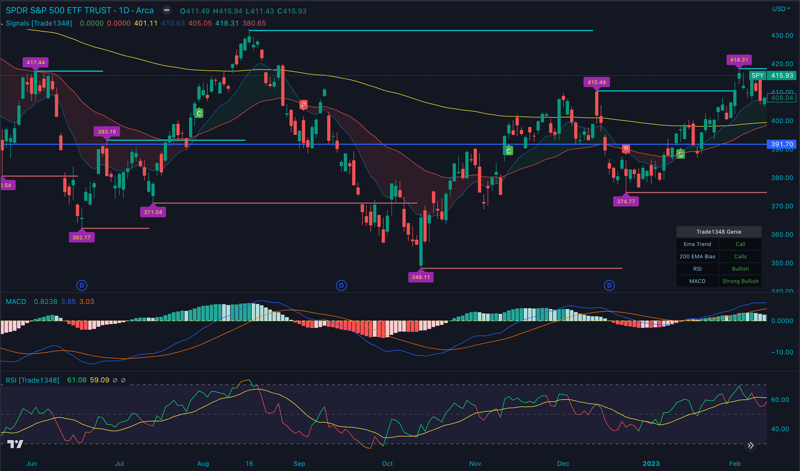
The EMAs
- 13 EMA - The 13 EMA signal line is drawn out in Blue.
- 48 EMA - The 48 EMA signal line is drawn out in Red.
- 200 EMA - The 200 EMA signal line is drawn out in Yellow
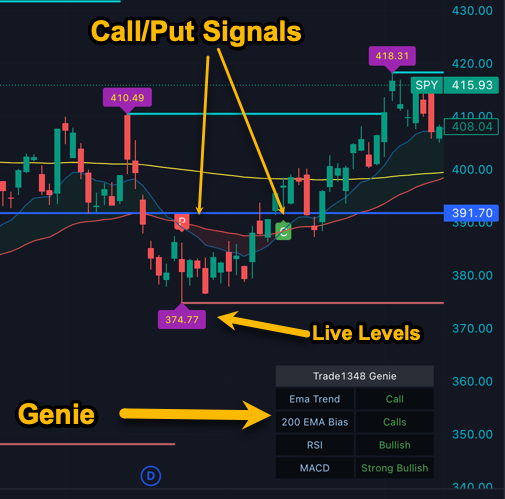
The Genie
Our proprietary Genie will make the strategy extremely Dummy Proof by letting you know the trend direction.
- EMA Trend - whether the overall trading activity is trending towards a call or a put.
- 200 EMA Bias - Our core strategy dictates that when action is above the 200 the trade is bias to Calls, and below the 200, the trade are bias to Puts. We tell you in real-time where the trend is currently located.
- RSI - whether the strength of the move is Bullish or Bearish.
- MACD - whether trading activity is in a Bull or Bear trend.
Our core 1348 and Master charts will have additional real-time details on all plays. Be sure to check them out for a more streamline trading experience.
Live Levels
As the day progresses, our charts draw relevant levels which you will learn to respect as points of interest in each trade.
MACD and RSI Indicators
As part of our strategy, we use these indicators as confirmation to our thesis. Our training will help guide you through using them to include or exclude a potential trade, as well as choosing when to exit your trade.