MACD Indicator
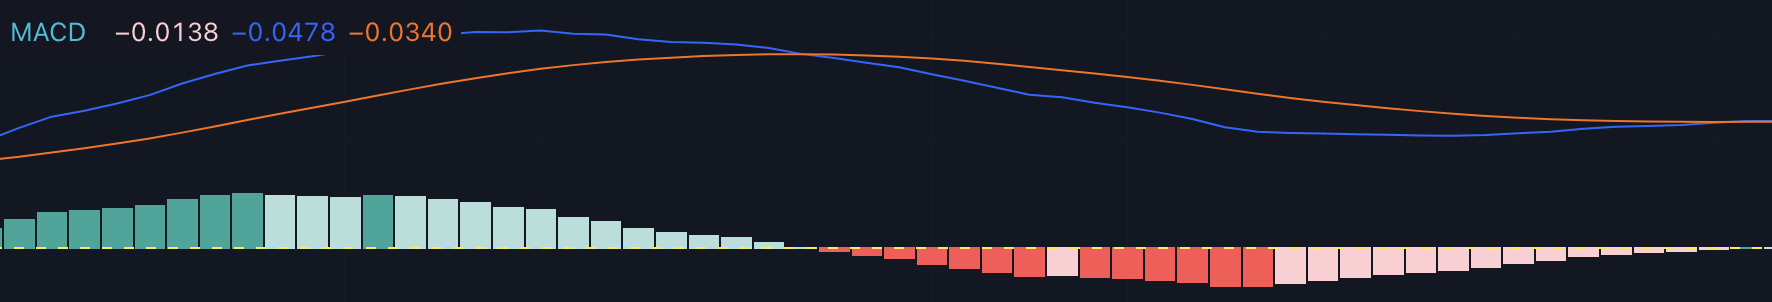
The Trade 1348 custom MACD is an indicator that helps you understand a stock's momentum by showing a line graph above and below the zero line (MACD neutral line).
Go To Indicator, then click "Add To Favorite Indicators"
Key information for the custom MACD:
- Bullish signal: When the MACD line crosses above the signal line, the stock's momentum is increasing.
- Bearish signal: When the MACD line crosses below the signal line, the stock's momentum is decreasing.
- Trend direction: If the MACD line is above the zero line, the trend is bullish. If it's below the zero line, the trend is bearish.
- Momentum shift: A change from dark green to light green or dark red to light red in the histogram indicates a momentum shift based on the current trend's weakness.
- Trend strength: Dark green or dark red in the histogram shows the current trend's strength.
Use this custom MACD with other indicators for better trading decisions.